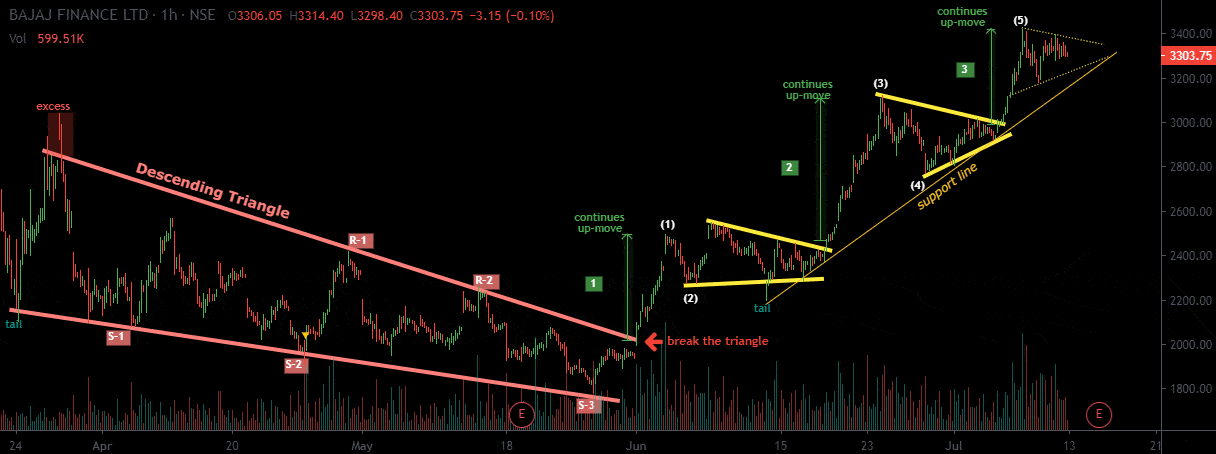
Bajaj Finance has already formed a descending triangle
It has break its triangle in up-direction and now this stock is following an up-direction.
You can see in the chart i have mentioned “continues up-move”
after every continues up move the stock always form a small triangle and there is a price rotation.
The stock has taken perfectly it’s support every-time.
MoneyMunch.com |  |
| Bajaj Finance LTD chart analysis: Posted: 11 Jul 2020 04:52 AM PDT The post Bajaj Finance LTD chart analysis: appeared first on Moneymunch. |
| You are subscribed to email updates from Moneymunch. To stop receiving these emails, you may unsubscribe now. | Email delivery powered by Google |
| Google, 1600 Amphitheatre Parkway, Mountain View, CA 94043, United States | |

