| Staging a Comeback – Why These Might be the Hottest Assets to Buy Now! |
Tuesday, 2 April 2024  | | By Brian Chu | | Editor, Gold Stock Pro and The Australian Gold Report |
|
[8 min read] | In this Issue: - How inflation and a rising US dollar spurred gold but smashed gold stocks
- A valuation gap like you’ve never seen before
- Breaking out – When some gold explorers jump, they soar
- Our offer to you to join in this potential rush!
- Deficits are especially important.
|
|
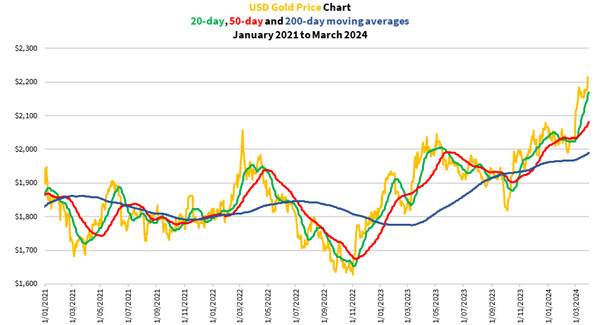
Dear Reader, There’s much talk about how overbought the global markets are looking with each passing day. The major market indices are setting new records, including our very own ASX All Ordinaries [ASX:XAO], which is also breaking into all-time new highs. Those looking for value in this market are having a hard time uncovering opportunities. But one place is offering exceptional potential. A handful of companies have taken off. More are setting up recently, rising double-digit percentages in a day. Some might be too late to chase now. But if you’ve got the appetite for taking calculated risks for the potential of handsome benefits, now is your chance to jump on board to capture these opportunities. Some of you are familiar with the assets I’m talking about. Like me, you might’ve been invested in this for some time, watched many of them grind lower and wondered whether it’s time to pull the plug. You guessed it. I’m talking about gold stocks. And while I sound like a broken record, I think we’re in for a real treat. How inflation and a rising US dollar spurred gold but smashed gold stocks Gold’s now trading at record levels in almost every global currency. People are starting to pay attention as it sets new records, closing at just over US$2,250 an ounce overnight. It’s increased almost 20% since the start of 2021.
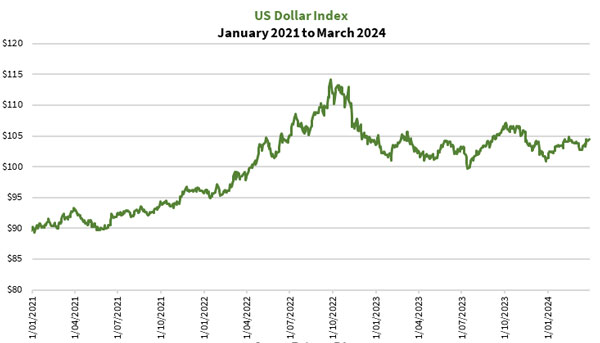
As you can see, gold traded between US$1,600–2,080 an ounce until last month when it started breaking out. Things started heating up when the US Federal Reserve announced last month that it planned to cut rates three times this year. Since then gold has taken off. The figure above shows the price of gold in US dollar terms, but it doesn’t show how the dollar strengthened more than 15% against other currencies during this time. Here’s how the US Dollar Index [DXY] performed during this period:
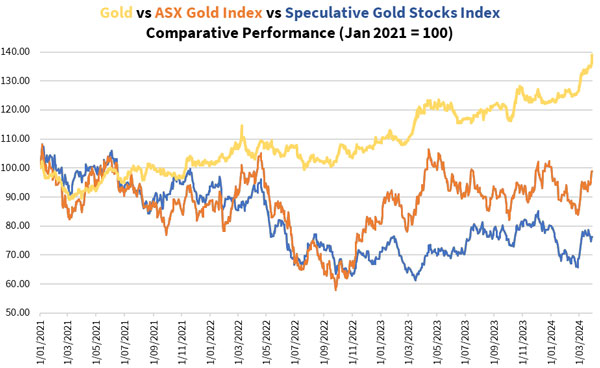
The rise of the US Dollar Index from 2021 to late 2022 coincided with the aggressive rate rise cycle of the US Federal Reserve and other central banks seeking to combat inflation. While central banks can claim to have controlled headline inflation, businesses and households have had to endure rising costs. A valuation gap like you’ve never seen before Mining companies have borne the brunt of rising costs that have eaten into their profit margins. Gold stocks weren’t an exception. Let’s have a look at the growing gap between gold and gold mining stocks below:
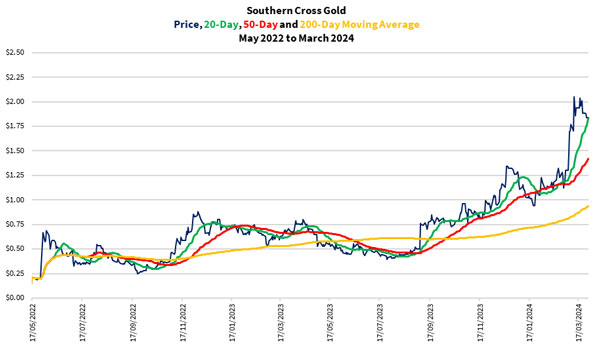
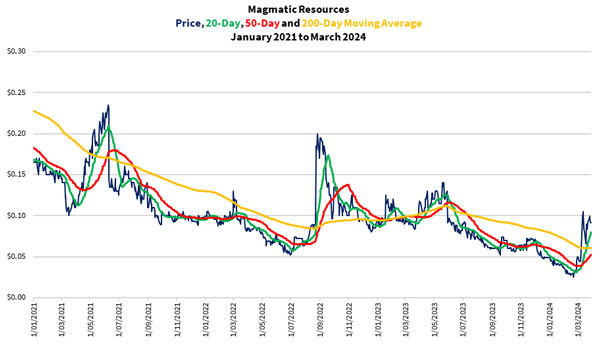
As you can see, while gold producers have recovered much of their losses since late-2022, smaller explorers still trade well below their levels in 2021. This gap is especially unusual when gold has gained strongly. I wrote about this recently, highlighting how the rising price of oil in 2021–22 and the border closures have contributed to runaway operating costs. Notice how the gold stock indices (orange and blue lines) are starting to move higher and attempting to close the gap between gold and equity performance. Gold stocks continue to hold above their October 2022 and March 2023 lows. They’re now embarking on a strong upward move. To me, gold stocks look ready to play catch-up with the underlying gold price. Now these are the gold stock indices. But if you dig into the individual companies, you’ll find some have delivered eye-watering moves recently. Which is what I want to talk about next. Breaking out – When some gold explorers jump, they soar I’ve written about how the more established gold producers have largely recovered the losses sustained in the recent bear market. These include; Northern Star Resources [ASX:NST], Perseus Mining [ASX:PRU], Emerald Resources [ASX:EMR], Westgold Resources [ASX:WGX] and Bellevue Gold [ASX:BGL]. But gold explorers haven’t followed YET. In fact, many are still trading close to their all-time lows. A precious few have jumped out of the gates. Some have started to take off, delivering jaw-dropping returns. Let me give you two names. I’m sure some of you have heard of Southern Cross Gold [ASX:SXG]. An explorer based in Central Victoria; it happens to be one of my best picks! My readers have enjoyed almost 300% returns since buying it last August. They’ve booked part profits recently and are now playing with the house’s money. Let me show you the meteoric rise of this company since it listed in May 2022: The reason for its stunning performance is they’ve drilled several exceptional holes at Sunday Creek, located near Kilmore which is one hour’s drive north of Melbourne. These holes indicate the potential for a sizable high-grade gold and antimony deposit. While sentiment has all but dried up for gold explorers over this period, Southern Cross Gold was one of the rare companies that managed to keep the light flickering in this space. Investors have enjoyed substantial rewards. Though there could be more to come as the company prepares to release its maiden resource estimate in the coming months. Another company is Magmatic Resources [ASX:MAG]. This company’s share price jumped twice, once in 2021 and another in mid-2022. You can see it below:
These jumps happened when it announced massive copper and gold veins stretching hundreds of metres at its Kingswood prospect in Central New South Wales. However, unlike Southern Cross Gold, the good news wasn’t enough to stem the declining investor sentiment in this space. The share price made new lows in mid-2022 and then again earlier this year. Its fortunes changed in late-February as investors bought into the news that Fortescue Mining [ASX:FMG] would invest into the Kingswood project as a joint venture partner. The price has since jumped almost 250%! All this within a month. Of course, not all my picks have performed as well as the two above. And there are no guarantees that these stocks will continue on an upwards trend. Gold explorers are some of the riskiest stocks on the market. Our offer to you to join in this potential rush! Now these two companies are among the first to blast off. But many others are stirring from a prolonged lull, rising by double-digit percentage points over a few days. Some are able to hold these gains, a sign that suggests this space is heating up. That’s why, in response to surging activity across the gold space, we’ve reopened our event, Gold Strike 2024. Even if you have watched it, I suggest watching it again. Everything I outlined in that presentation is now playing out. This is an exciting time to consider investing in gold explorers. Which company could soar next and repeat the performance of Southern Cross Gold or Magmatic Resources? I’ve analysed this space and prepared a shortlist of companies I believe have strong potential. That’s why I invite you to check out the event and consider signing up. The offer closes at midnight tonight so I hope you get onto it now! God bless,
Brian Chu,
Editor, Gold Stock Pro and The Australian Gold Report Brian Chu is one of Australia’s foremost independent authorities on gold and gold stocks, with a unique strategy for valuing big producers and highly speculative explorers. He established a private family fund that only invests in ASX-listed gold mining companies, possibly the only such fund in Australia, putting his strategy and research skills to the test under public scrutiny. He currently writes two gold-focused investment advisories. In his Australian Gold Report, Brian shows you a strategy for building long-term wealth in physical gold, along with a select portfolio of hand-picked stocks, mainly producers with proven revenue streams, chosen for their balance of risk and reward. In his more specialised Gold Stock Pro service, Brian helps readers trade some of the most exciting, speculative gold mining plays on the ASX. He uses his proprietary system — based on the famous Lassonde Curve model, which tracks the life cycle of mining stocks. His aim is to help you get ready to trade the next phase of gold and silver’s anticipated longer-term bull market for opportunities to benefit. Advertisement: THREE GOLD STOCKS TO PLAY THE COMING BULL MARKET The founder of The Australian Gold Fund believes the Australian gold stock sector is already in a bull market in 2024. Discover the details on three stocks he’s recommending to play the potentially historic bull run in 2024: CLICK HERE FOR ALL THE DETAILS |
|
 | | By Bill Bonner | | Editor, Fat Tail Daily |
|
[3 min read] Dear Reader, April Fool! The inflation and GDP numbers are just ‘made up’. Last week, the economic news, coming from inside the Beltway, was swell. MarketWatch: ‘GDP update boosts U.S. fourth-quarter economic growth rate to 3.4% ‘The final reading of U.S. growth in the 2023 fourth quarter was raised a few notches to a 3.4% annual pace, reflecting strong consumer spending and a surprisingly resilient economy. ‘The government previously said gross domestic product had expanded at a 3.2% rate in the final three months of last year. The figure is adjusted for inflation.’ ‘Adjusted for inflation’ is one of those expressions like, ‘we were only following orders;’ it can hide a mountain of mischief. Over the last two years, we have often seen the inflation of the ’22-’23 period compared to the inflation of the 1970s. We have been told that today’s inflation rate peaked at 9% in 2022 and then came down quickly. But if you measured today’s price increases the way they did in the ‘70s, you’d see that our current inflation is much worse today than it was then. Marc Faber reports: ‘Former Secretary of the Treasury for President Clinton, Lawrence H. Summers, recently published a figure which showed that inflation had been and still was far higher than what the BLS had calculated…. Using the CPI as calculated before 1983, Summers estimated last year’s peak inflation at 18%. According to his methodology, interest rates would still be far too low. In other words, Bidenomics, with large fiscal deficits and negative real interest rates, would still be inflationary.’ Are you thinking what we’re thinking? If the inflation reading is false, so is the GDP rate. And so is the whole financial picture. Let us begin with the measure of inflation itself. According to the Bureau of Labor Statistics (BLS), food rose (at an annual rate) of 2.7% last year; services went up 3.5%, and shelter rose 4.8%. Already, we are deeply suspicious. Charlie Bilello reports: ‘The monthly mortgage payment needed to buy the median-priced home in the US has increased 80% over the last 4 years, moving from $1,500 per month to $2,700.’ Between higher mortgage payments and higher house prices, an increase of only 4.8% for the cost of shelter seems almost impossible. But even taking the BLS numbers, it is hard to see how they could apply a ‘deflator’ of just 1.66%. Which is just proof that although numbers may not lie intentionally, if you torture them enough they will say whatever you want them to say. And if you use the 1980 method of calculation, the whole picture of the US economy suddenly turns dark. Summers’ numbers show price increases through the end of last year running in the 10% to 12% range. Deflating the nominal GDP number, then, would give us a NEGATIVE growth rate of at least MINUS 7% — a huge loss in real GDP. And what about the stock market? When you get a ‘gain’ or a ‘profit’ from your stocks, you think you are better off. And now, everyone thinks the stock market has ‘recovered’ from its 2022 sell-off. But has it? A fair guess is that consumer prices are 25% higher than they were at the Dow peak in 2021. If so, the Dow would have to go to 45,000...just to breakeven. Down in gold terms We turn to gold to try to keep our story straight. From its peak at the end of 2021, to today, the Dow is up almost 4,000 points. But adjusted for the price of gold, it is still down nearly 10%. Backwards? Forwards? Which way are we going? Another curiosity of the GDP growth story is the role of fiscal deficits. If the government spends another billion dollars – even if it is frittered away on weapons – the amount is included as a plus in GDP. So, the more the feds spend, the higher GDP goes...at least in the short-run. Deficits are especially important. If the government takes in $100 in tax revenues, and spends it, it removes that money from the consumer economy. No net increase to GDP. But if it borrows the money, the extra spending it comes as if ‘out of nowhere’ and is added to the total. There is no offsetting draw-down in the consumer economy, so GDP goes up. Last year, federal deficits were 6% of GDP. That was money that the feds spent but didn’t raise from taxes. It must have gone somewhere. So, here’s a simple question: How could the feds pump an additional 6% (of GDP) into the economy, with almost $3 trillion added to the national debt, but only get an increase of 3.4% (annualised from the fourth quarter) in GDP? What happened to the other 2.6%? Where’s the missing $1.2 trillion? Where did the money go? Does this mean that the real — non-government — economy is actually shrinking at such an alarming rate that it wipes out much of the feds’ new-money inputs? Or are these numbers just so ‘made up’ that they are meaningless? More tomorrow,
Bill Bonner,
For Fat Tail Daily All advice is general advice and has not taken into account your personal circumstances. Please seek independent financial advice regarding your own situation, or if in doubt about the suitability of an investment. |
|
Advertisement: What’s the REAL reason bitcoin
is flying high once again…? Ryan Dinse’s bitcoin $1 million hypothetical timeline is tracking EERILY WELL so far… Click here and he’ll walk you through a new updated version. You’ll learn why bitcoin has value...and why that value is growing in the crazy climate that is 2024… How the blockchain has enabled entirely new ways of owning, trading, creating and sharing value... How the ‘smart money’ is behind this recent up-phase...and what it’s buying and why... Perhaps, most helpfully, Ryan will show the kinds of things he’s doing with his own money right now. Ryan’s personal investment portfolio has over 30% allocated to crypto. We hope you’ll learn by watching what he’s doing with it…what he’s testing and trying...and who Ryan’s doing it with... Click here to read The Road to $1 Million. |
|
|